
School District Tax Maps
What they show, and what they don’t.
I am uploading some maps that show the distributions of property tax assessed values in various school districts around the Island. These are single family year round homes, property classes 210-219.
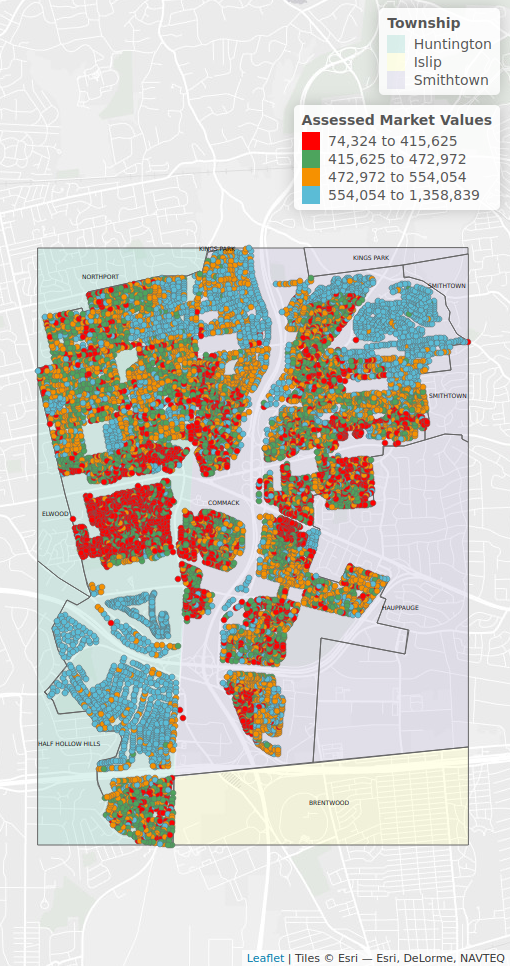
These maps indicate not only the geographic distribution of the values, which you can see by the color-coded map – but also the range of the distribution “quartiles”.
Each color, and its value range, represents 25% of the properties shown on the map.
So, to read this legend for Commack Schools- half of properties are assessed at less than $475K.
Right now, on Trulia.com there are zero homes available in Commack School District under $525K, of 42 listings.
The numbers in these public-facing maps are rounded a bit (truncated, actually) and will not be 100% accurate.
There have been numerous errors in the underlying data, if you see something – say something, I will verify and update what I can.
This site is not intended to be used to research (use your local assessor’s website) or stalk, which is why zoom is limited and street names obscured.
Here are Commack, Sachem, and Three Village maps to start.